CRQC Readiness Benchmark vs. Quantum Threat Tracker (QTT)

Table of Contents
Introduction
As someone deeply involved in quantum security, I have been exploring ways to measure our progress toward a Cryptographically Relevant Quantum Computer (CRQC) – specifically, the point when a quantum computer can break RSA-2048 encryption (“Q-Day“). In this context, I previously proposed a CRQC Readiness Benchmark (proposed initially in 2020 and recently updated) as a kind of progress index.
In the meantime, Cambridge Consultants with the University of Edinburgh released the Quantum Threat Tracker (QTT) tool, which forecasts timelines for cryptographic breaks. I previously briefly reviewed the QTT (and offered some critique for their default demo image).
Today, I will try and compare my proposed CRQC Readiness Benchmark with QTT, highlighting fundamental differences in methodology, assumptions, and philosophy, all in an effort to clarify how each approach informs our understanding of the looming “Q-Day.” The goal is to articulate why my benchmark and QTT produce different outlooks (2030s vs. 2050s for RSA-2048), and how both can be used together to guide post-quantum readiness.
Overview of the Two Approaches
CRQC Readiness Benchmark (My Approach)
I designed this benchmark as a crypto-centric composite metric to gauge how close we are to a quantum computer capable of defeating RSA-2048. Instead of predicting a calendar date, it produces a single normalized score (ranging from 0 up to 1.0 and beyond) that represents current quantum capability relative to the RSA-2048 breaking threshold. By definition, a score of 1.0 corresponds to the capability needed to factor an RSA-2048 key in about one week: a practical benchmark for saying “RSA-2048 is effectively broken.” The score is derived from combining three key dimensions of a would-be cryptanalysis machine:
- Logical Qubit Capacity (LQC): the number of error-corrected logical qubits available for computation.
- Logical Operations Budget (LOB): the total count of quantum gate operations that can be executed reliably within the machine’s coherence/error limits (essentially how deep a circuit it can run).
- Quantum Operations Throughput (QOT): the speed of execution, e.g. how many logical operations per second the computer can perform (related to clock speed and parallel operations).
These factors are synthesized into a composite score formula (roughly, (LQC / 1000) × (LOB / $$10^{12}$$) × (QOT / $$10^6$$)) which is calibrated such that 1.0 indicates the RSA-2048 one-week factoring capability. For example, if a hypothetical quantum computer today has about 100 logical qubits, can perform $$10^{10}$$ operations before decoherence, and runs at $$10^4$$ ops/sec, its score might be on the order of 0.001, meaning roughly 0.1% of the power needed to break RSA-2048 in a week. The benchmark thus acts like a progress bar toward a CRQC, updating as hardware and algorithms improve.
Notably, it directly incorporates the latest advances: if a new algorithm or error-correction technique reduces the qubit or gate requirements to factor RSA-2048, the target for 1.0 is adjusted accordingly. In essence, this readiness score is descriptive of the current state of quantum threat capability, it tells us “we are at X% of the goal” and can be recalculated in real-time as breakthroughs occur, without speculating on when the next breakthroughs will happen. My projections (assuming aggressive progress) suggest that the score could reach 1.0 by around 2030, implying Q-Day in the early 2030s under optimistic but plausible developments.
I also developed a simple tool – CRQC Readiness Benchmark (Q‑Day Estimator) – to allow you to play with the four inputs: LQC (logical qubits), LOB (logical operations budget), QOT (logical ops/sec), and an annual growth factor; and then combine it into a Composite CRQC Readiness Score and a projected “Q‑Day” (when week‑scale factoring of RSA‑2048 becomes practical). My approach and the tool are intentionally focused on cryptographic breakability, not generic “quantum advantage,” so it may diverge from headline qubit counts.
For more details about the CRQC Readiness Benchmark see: “CRQC Readiness Benchmark – Benchmarking Quantum Computers on the Path to Breaking RSA-2048.”
Quantum Threat Tracker (QTT)
QTT is an open-source tool that takes a somewhat different approach – instead of a single progress metric, it provides timeline estimates for when various cryptographic algorithms (RSA of different key sizes, elliptic curve cryptography, etc.) will be broken by quantum computers. Developed by Cambridge Consultants and the University of Edinburgh’s Quantum Software Lab, QTT combines Quantum Resource Estimation (QRE) with hardware growth extrapolation.
First, it uses known quantum algorithms (like Shor’s algorithm and its optimized variants) to calculate how many logical qubits, how many gate operations, and how much runtime would be required to break a given cryptosystem. For example, QTT’s resource estimator might determine that using the Gidney-Ekerå 2019 optimized Shor’s algorithm, factoring a 2048-bit RSA number would need on the order of ~6,000 logical qubits and about 8 hours of runtime (plus millions of physical qubits for error-correction, under certain assumptions). It also includes newer techniques like Chevignard et al. (2024), which showed how to factor RSA-2048 with far fewer qubits by trading off more operations. Once QTT has the resource requirements for an attack, it then projects forward in time: it assumes some rate of improvement in quantum hardware (qubit count growth, error rate reductions, gate speeds) and estimates in which year those required resources will become available. The output is typically a chart or timeline indicating, for each year in the future, how quickly a given encryption scheme could be cracked.
In its default configuration, QTT is intentionally conservative. The demo scenario provided by its authors assumes relatively slow and steady progress, roughly an order of magnitude increase in qubit counts per decade, with error rates improving gradually. Under those assumptions, QTT’s sample output shows RSA-1024 becoming vulnerable circa 2047, and RSA-2048 around 2051. In other words, it predicts we have over 25 years before a quantum computer can crack RSA-2048. This late timeline is not because QTT is unaware of recent advances (it does factor in the 2019 and 2024 algorithmic improvements noted above), but because it intentionally uses cautious inputs about how quickly hardware will scale and how efficiently error-correction can be implemented. The QTT tool then provides visualizations, for instance, a graph of “Years to break vs Year” for each algorithm, or a table listing the projected break year for RSA-1024, 2048, 4096, etc., given those inputs. It’s worth noting that QTT is configurable: users can plug in more optimistic hardware growth rates or assume better error-correction overhead, and they would get earlier dates as a result. But many users will likely refer to the default scenario as presented.
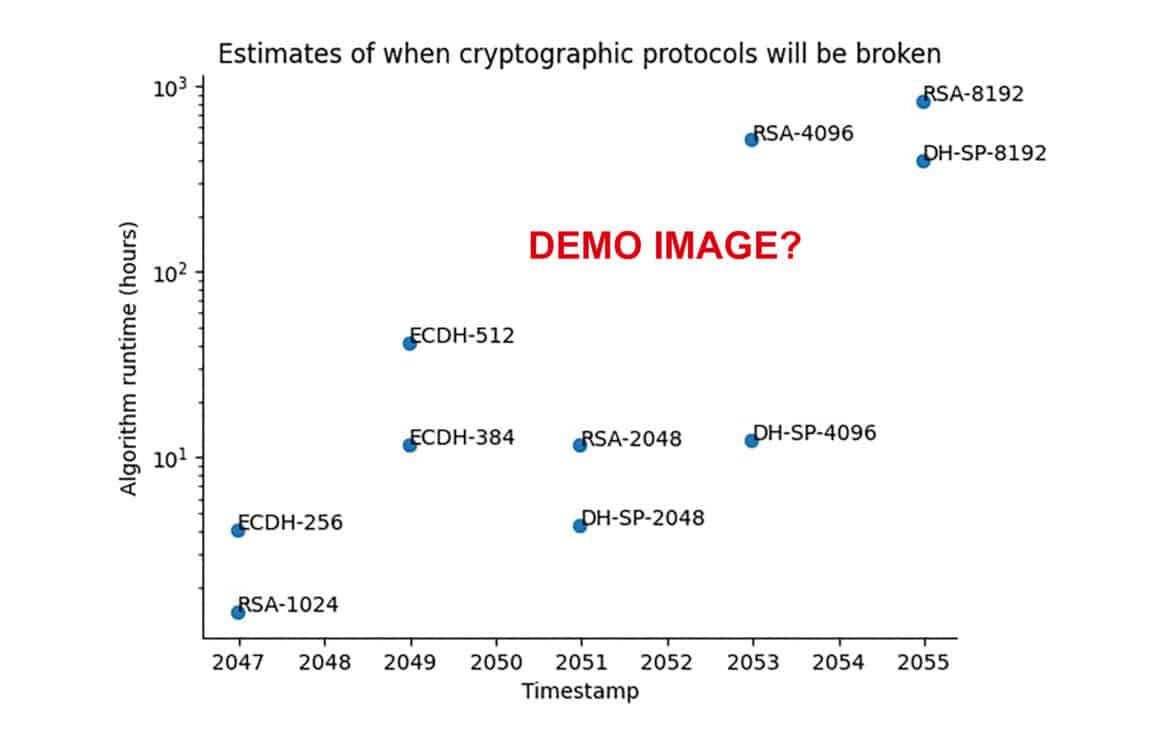
Figure: QTT’s default demo output forecasting when various cryptosystems could be broken. Under these conservative assumptions, RSA-1024 is projected to fall around 2047, and RSA-2048 around 2051. (Vertical axis is the required attack runtime on a log scale; shorter bars mean faster breaks.) This contrasts with my estimate that RSA-2048 could be broken by ~2030-2035 under more aggressive progress scenarios.
Fundamental Methodological Differences
Both the CRQC Readiness Benchmark and QTT aim to illuminate the quantum threat, but they do so in fundamentally different ways. Here are the key methodological differences between my approach and QTT:
Metric vs. Timeline – Progress Bar vs. Countdown
My CRQC benchmark produces a single composite score representing how far along we are toward a specific cryptographic breaking capability (RSA-2048 in this case). It’s like a progress bar that fills up as we approach the goal of factoring RSA-2048 in a practical time.
In contrast, QTT outputs a time projection, effectively a countdown calendar for multiple cryptographic targets. QTT doesn’t say “we are X% there”; instead, it says “on the current trajectory, RSA-2048 will be breakable by year Y.” My benchmark is cryptosystem-specific (one target at a time, currently RSA-2048) and normalized to that target’s requirements, whereas QTT tracks many algorithms (RSA with various key sizes, elliptic curves, etc.) and gives each a separate estimated timeline.
This means my approach provides a unified threat level indicator, while QTT provides a more granular forecast per algorithm.
Descriptive vs. Predictive Use of Uncertainty
My benchmark is descriptive of the present capability – it takes the best current data (latest qubit counts, gate fidelities, algorithmic efficiencies) and tells us where we stand right now relative to the RSA-breaking threshold. It doesn’t inherently predict future improvements; rather, it can be updated as improvements occur.
QTT, on the other hand, is explicitly predictive. It must assume a future growth rate for quantum computing performance (hardware and perhaps algorithmic progress) and extrapolate that over decades. As a result, QTT’s output is more subject to the uncertainties of technological acceleration or surprises: if progress accelerates (or slows) beyond the assumed rate, the timeline shifts accordingly. My benchmark avoids that by not baking in a specific growth rate, it’s more of a real-time gauge, whereas QTT commits to a particular extrapolation, which could prove too pessimistic or optimistic.
In short, my approach frames the uncertainty as “we don’t know how quickly we’ll get there, but here’s how much capability we have so far,” while QTT frames it as “given conservative assumptions, we project we’ll get there in X years.”
Hardware Growth and QEC Assumptions
A crucial difference lies in how each approach treats hardware scaling and quantum error correction (QEC) overhead. My CRQC readiness metric leans on aggressive industry roadmaps and recent breakthroughs. For instance, I factor in that researchers have achieved two-qubit gate fidelities in the $$10^{-7}$$ error range (one error in 10 million or even 100 million operations) in 2023/2024, and that experimental quantum error-correcting codes (like certain LDPC codes or subsystem codes) promise far lower overhead than the textbook surface code. Thus, I might assume that by the late 2020s, one logical qubit could be maintained with on the order of only hundreds of physical qubits (if error rates keep improving), rather than thousands. I also take seriously the claims of quantum hardware roadmaps: e.g., IBM’s stated plan for a 100,000-qubit quantum machine by 2033 and other companies predicting even larger scales before 2030. While these figures are not guaranteed, my benchmark’s philosophy is to incorporate the possibility of rapid progress, essentially saying “if these goals are even partially met, how close would we be?”
By contrast, QTT’s default approach is deliberately conservative on hardware. It appears to assume qubit counts will grow at roughly a single-exponential rate (something like 10× every decade in the number of qubits, which historically has been the case in the last 10 years of small-scale devices). It also assumes a high overhead for error correction using standard methods, for example, if physical gate error rates stay around $$10^{-3}$$, you might need thousands of physical qubits to stabilize 1 logical qubit. QTT’s 2051 default timeline for RSA-2048 implies that the model doesn’t expect more than a few thousand logical qubits until mid-century.
In other words, my benchmark bets on optimistic improvements (potentially super-exponential growth akin to “Neven’s Law”), whereas QTT sticks to cautious extrapolation of demonstrated trends. The result: my calculation shows the gap closing much sooner, while QTT’s shows a long slog where the required scale (e.g. thousands of logical qubits) isn’t reached until the 2050s.
Incorporation of Algorithmic Breakthroughs
Both approaches acknowledge that better quantum algorithms (or optimizations of existing ones) can dramatically change the game by lowering the resource requirements to break cryptography. However, my readiness score explicitly adjusts to each new breakthrough. For example, when Craig Gidney (Google Quantum AI) announced in 2025 an additional ~20× speedup in factoring circuits (beyond the 2024 Chevignard result), bringing the estimated physical qubits for RSA-2048 factoring down to under one million with a week-long runtime, I would update the benchmark’s “1.0 threshold” to reflect this lowered bar. The score immediately tells us that the world’s best quantum computer (on that day) jumped closer to the goal, even if hardware hasn’t changed – because the goalpost moved closer.
QTT, in its default form, only includes algorithms known up to 2024. It has Baseline Shor, Gidney-Ekerå (2019), Chevignard et al. (2024) built in as options. But it cannot foresee algorithmic improvements that haven’t been published yet. If a new algorithmic trick comes out in 2025 or 2026 (which it very likely will), QTT’s predictions would remain the same until someone manually updates the tool with the new data. This means QTT’s timelines could quickly become outdated unless continually maintained. In practice, my criticism has been that QTT’s demo might not reflect the very latest (e.g., Gidney’s 2025 work was possibly not included, given the timing), whereas my metric was explicitly designed to be forward-looking in the sense of “assuming people will keep finding improvements, the effective difficulty of RSA-2048 keeps dropping.”
Another nuance: my benchmark treats the cryptographic task difficulty as a moving target that tends to get easier over time, while QTT locks in today’s difficulty level and asks when hardware will catch up to that. If tomorrow a new algorithm halves the difficulty, my progress bar would jump (since the denominator got smaller), but QTT’s timeline would suddenly look overly conservative (since the requirement it thought was X logical qubits is now X/2).
Definition of “Broken”
We even define the threshold of “cryptographically broken” differently. In my benchmark, I chose a practical yardstick – one week runtime to factor RSA-2048. The rationale is that if a quantum adversary can break your 2048-bit key in a week, the encryption is as good as dead for security purposes; it might not be instantaneous, but it’s within operational reach (especially for nation-states or well-funded attackers who could run multiple attacks in parallel). I consider that sufficient to call RSA-2048 compromised. The benchmark score can exceed 1.0 to indicate even faster cracking (e.g., score 2.0 might mean it can be done in a few hours, etc.), but 1.0 is the critical threshold.
QTT’s perspective seems to set a higher bar for calling something “broken.” From what I gather, QTT might only declare RSA-2048 truly insecure when a quantum computer can break it extremely quickly, perhaps on the order of hours or less. If QTT’s default timeline says 2051 for RSA-2048, it could be because they define “broken” as, say, “can be cracked in one day or overnight.” Under that criterion, even if by 2035 a quantum computer could factor RSA-2048 in a week, QTT might still consider that not the final break until the tech improves further.
This philosophical difference means my timeline (early 2030s) flags the moment RSA-2048 is even marginally practical to attack, whereas QTT’s timeline (2050s) might be flagging the point when it becomes trivially quick to attack. It’s a more conservative threshold for action, arguably too conservative, because most security experts would agree that a one-week factorization ability would already be catastrophic for classical RSA. This nuance can lead to a perception gap: my benchmark would ring the alarm as soon as that week-long attack is feasible (score 1.0), but QTT might still show “not broken” until the attack is just hours, thereby delaying the apparent Q-Day in its charts.
Key Philosophical Differences
Beyond the technical methodology, there are philosophical and audience-related differences in the design of my CRQC benchmark versus QTT:
Risk Posture (Urgency vs. Caution)
My approach is intentionally alarm-raising. I err on the side of highlighting progress and proximity to danger. The underlying motive is that I don’t want organizations to be complacent; the threat of “Harvest Now, Decrypt Later” is real, meaning data being stolen today could be decrypted once a CRQC comes online. Therefore, I’d rather present a metric that says “we are already, say, 10% or 30% of the way to breaking RSA-2048 – and that fraction is growing” to spur action now.
QTT’s creators, however, took a conservative risk posture. Their philosophy (as stated in their materials) is to avoid hype and prevent overestimation of the quantum threat. They prefer to under-promise and over-deliver, i.e., give a later timeline if in doubt, since it’s safer to be pleasantly surprised than to panic prematurely. This is sensible for not crying wolf, but the flip side (as I’ve argued) is that it may provide a false sense of security. If a Fortune 500 board sees “2051” as the forecasted break date for RSA-2048, they might wrongly conclude that quantum risk is a problem for their successors, not their tenure.
In summary, my benchmark emphasizes urgency (to prompt immediate quantum-safe transitions), whereas QTT emphasizes caution (to avoid knee-jerk reactions to speculative threats).
Target Audience and Use Case
The two approaches speak to slightly different audiences and needs. My CRQC readiness benchmark is aimed at a technical and security research audience – people who are closely tracking quantum computing progress and cryptographic vulnerability. It’s useful for cybersecurity strategists, cryptographers, and tech-savvy policymakers who want a simple indicator of “how close are we, really?” It can be updated frequently (even continuously) as new data comes in, which suits an R&D environment or threat monitoring function.
QTT, on the other hand, seems geared more towards policymakers, executives, and planners who need to do strategic planning. A CISO or government agency, for example, might ask “by what year do I need to have all my systems migrated to post-quantum cryptography?” QTT provides an answer in the form of a timeline (with error bars or scenarios, ideally). It covers multiple cryptosystems, which is useful because an organization might prioritize migrating algorithms expected to fail sooner (say RSA-1024 or certain ECC) before those predicted to fail later. The broad coverage and timeline format make QTT a good educational tool for raising awareness (ironically, my critique is just that if people take the conservative scenario as gospel, it could have the opposite effect of lowering urgency).
In essence, my benchmark is a real-time tracker for specialists, while QTT is a forecasting tool for decision-makers.
Flexibility and Perception
QTT is highly configurable in principle – you can dial in different assumptions, upload new roadmaps, pick different algorithms, etc. That flexibility is great for analysts who want to stress-test various “what if” scenarios (e.g., “What if someone achieves a 100x improvement in error rates in 5 years, when would RSA-2048 fall?”). However, most people will just look at the default settings or whatever demo is provided. The default assumptions in QTT then have an outsized influence on perception. In the current demo, those defaults lead to the 2050s dates, which as I’ve noted, deviate from what many experts (including myself) believe, that the 2030s are more likely. The QTT authors did choose conservative defaults conscientiously, but they also risk being misinterpreted as an official expert prediction.
Conversely, my CRQC benchmark is simpler and less flexible, it’s basically fixed on the RSA-2048 problem (by design, to provide a clear focus). It doesn’t output a whole set of scenarios; it gives one composite score (which could be recalibrated if needed). The strength of this simplicity is that it’s easy to understand (one number to watch, like a Doomsday Clock). The weakness is that it doesn’t automatically tell you about other algorithms or provide a range of possibilities. I rely on users (or myself) to update the benchmark’s parameters as the world changes. In a way, my approach is manually flexible (we can adjust it as needed over time) but not interactive software, whereas QTT is software-level flexible but in practice will be as good as the effort people put into keeping it up-to-date.
Strengths of Each Approach
It’s worth emphasizing that both the CRQC Readiness Benchmark and QTT have their merits, and they serve different purposes. Summarizing the strengths of each:
CRQC Readiness Benchmark – Strengths
It provides a simple, intuitive indicator of progress toward a critical cryptographic break. The single score is easy to communicate (e.g., “we’re at 0.3, which is 30% of the capability needed for Q-Day”). It directly ties to a concrete milestone (RSA-2048 in one week), which avoids ambiguity in what “threat” we’re measuring.
The benchmark is nimble in incorporating the latest research, if a new advance comes out tomorrow cutting requirements in half, the metric can immediately reflect that. By focusing on the here-and-now capabilities, it avoids the guesswork of extrapolating technology trends, instead acting as an early warning system. This makes it very useful for anyone who wants to track the quantum threat level in real time.
It’s also open conceptually, the methodology could be extended to other algorithms (for instance, one could define a similar benchmark for breaking AES-256 via Grover’s algorithm, though that’s a much harder problem for quantum). In short, its strength is in clarity and immediacy: it tells us how far quantum adversaries have come, in a single number, and it rises as those adversaries get stronger.
Quantum Threat Tracker (QTT) – Strengths
QTT’s big strength is its comprehensiveness and rigor. It not only looks at RSA-2048, but also treats RSA-1024, RSA-4096, ECC (e.g., 256-bit curves), Diffie-Hellman, etc., each possibly requiring different quantum resources. It uses well-founded quantum resource estimation techniques, leveraging academic work and tools (like Microsoft’s Azure QRE and Google’s Qualtran library) to get detailed numbers for qubits, gates, and time. The output is an actionable timeline which is exactly what many organizations ask for (they can map it to their cryptography upgrade schedules).
Being open-source, it invites transparency: anyone can inspect the assumptions, tweak them, or update the model as new data comes in. This openness means the community can improve it over time (e.g., incorporate a new algorithm or a new error-correcting code).
QTT’s conservative approach is also a form of prudence for critical infrastructure planning, it’s a bit like planning for the worst-case (or later-case) scenario, which some risk managers prefer so they’re not caught off-guard.
Additionally, by presenting its results visually (charts and graphs), QTT makes it easier to communicate the concept of quantum threat evolution to non-experts (provided the caveats are explained). In summary, QTT is systematic and versatile – it gives a broad, scenario-based view of the quantum threat landscape and is a solid foundation for discussion across industry and government.
Side-by-Side Comparison Table
To crystallize the differences, the table below provides a side-by-side comparison of my CRQC Readiness Benchmark and the QTT approach across various aspects:
| Aspect | CRQC Readiness Benchmark (My Approach) | Quantum Threat Tracker (QTT) |
|---|---|---|
| Core Methodology | Composite score (0 to 1.0+) representing progress toward breaking RSA-2048. Calculated from key factors: LQC, LOB, QOT. Acts as a “progress bar” of capability, calibrated such that 1.0 ≈ factoring RSA-2048 in ~1 week. Focuses on a single target (RSA-2048) as a representative milestone for CRQC. | Quantum Resource Estimation combined with timeline extrapolation. Calculates resources needed for various algorithms (e.g., RSA with different key sizes, ECC) using Shor’s algorithm variants, then projects a year when a quantum computer might have those resources given assumed growth rates. Outputs a “time-to-break” timeline for each cryptosystem rather than a unified score. |
| Key Metrics | LQC = effective logical qubits available; LOB = logical gate operations budget (circuit depth with error correction); QOT = quantum operations throughput (logical ops per second). These three encapsulate the machine’s capacity, quality, and speed. The product (appropriately normalized) gives the readiness score. In practice, also equivalent to tracking the max RSA key size factorable within ~week – as the score increases, the highest secure RSA key length decreases. | Core metrics are the logical qubit count, total gates (or circuit depth), and runtime required for each attack, and the physical qubit count after accounting for error-correction. It might say, for instance, RSA-2048 needs ~6,000 logical qubits and ~8 hours to break with a given algorithm. QTT then translates that into a year when 6,000 logical qubits might exist. So the “metrics” one sees are things like “X logical qubits, Y hours runtime = break in year Z.” Multiple cryptosystems are tracked in parallel. |
| Assumptions on Progress | Aggressive and optimistic: Embraces the latest breakthroughs and ambitious roadmaps. Assumes error rates will continue to improve (into the $$10^{-4}$$ to $$10^{-7}$$ range), and that new error-correction codes (e.g., LDPC or bosonic) will drastically reduce qubit overhead (perhaps 100:1 physical-to-logical qubits by ~2030). Also factors in industry claims (e.g., IBM’s goal of ~100,000 qubits by 2033, IonQ’s plans for millions of qubits by 2030). Essentially assumes quantum hardware growth might accelerate thanks to investment and engineering breakthroughs. Algorithmic improvements are expected to continue, making the cryptographic tasks easier over time. | Conservative and evidence-based: Assumes a steady, incremental growth in quantum computing. For example, qubit counts growing ~10× per decade, gate fidelities improving gradually (perhaps from 99% to 99.9% over many years), and using known surface-code-like QEC overhead (often thousands of physical qubits per logical qubit at $$10^{-3}$$ error rates). This results in a scenario where even by 2035, fully error-corrected computers might only have tens of logical qubits. Algorithmic advances are frozen at 2024 – QTT includes state-of-the-art up to Chevignard et al. 2024, but not beyond (it “cannot foresee future breakthroughs” by design). Any post-2024 improvements (e.g., a 2025 algorithmic speedup) are not assumed unless the user updates the input. The guiding principle is to not assume miracles, only incorporate what has been concretely demonstrated or published. |
| Timeline Output | Does not output a specific date by itself, instead it tells us current capability as a fraction of what’s needed. However, one can infer a timeline by plotting the score over time. If in 2025 the score is ~0.1 (10%), and by 2028 it’s ~0.5 (50%), one might extrapolate it reaching 1.0 around 2030-2032. In narrative terms, I often say “Q-Day could be around 2030” given how rapidly the gaps are closing. The benchmark score can go above 1.0 once the capability surpasses the one-week RSA break threshold, indicating increasing speed of attack. | Explicit timeline predictions: QTT might output something like “RSA-1024: 2047; RSA-2048: 2051; RSA-3072: 2058” (these are from the default demo). It often visualizes the declining time-to-break vs. the calendar years, e.g., showing that in 2040 perhaps RSA-2048 could be broken in $$10^4$$ hours, by 2050 in $$10^2$$ hours, etc. The timeline is only as good as the input assumptions – QTT invites users to try a more aggressive scenario (for instance, if one inputs a faster qubit doubling rate, those years will move earlier). But the headline numbers from its conservative default are late 2040s to 2050s for standard public-key crypto. |
| Error Correction & Overhead | Optimistic view: My approach assumes that recent QEC breakthroughs will carry over into practice. For example, researchers achieved a phenomenal two-qubit gate fidelity of 99.999985% in 2024 (only 1 error in 6.7 million operations), which is beyond the rough 99.9% surface-code threshold. I take this as evidence that physical qubit quality is on the cusp of what’s needed for effective error correction. Thus, I project that the overhead (physical qubits per logical qubit) will drop significantly – perhaps to just a few hundred to a thousand physical qubits for one logical qubit by the end of this decade, using advanced codes and high fidelity. That means a million physical qubits could potentially yield in the ballpark of 1,000 logical qubits (maybe more with better codes), enabling a CRQC earlier. Lower overhead = sooner threat. | Pessimistic view: QTT’s default sticks with conventional assumptions, likely a surface code or similar with ~0.1-1% error rates. Under such assumptions, the overhead is huge: each logical qubit might require thousands (even tens of thousands) of physical qubits to maintain low error over billions of operations. This drastically slows the effective growth of quantum computers. For instance, even if you had 1 million physical qubits (which is far off), at 0.1% error rate that might net you only on the order of 100 logical qubits. So QTT’s timeline accounts for a long detour for error-correction – the technology has to improve in physical error rates or new codes to reduce that overhead, and QTT doesn’t assume radical improvement on the near horizon. It may also not yet factor in some 2023-2024 QEC milestones like experimental demonstrations of small QEC codes operating below threshold, etc. Thus, its estimates of required physical qubits (and hence years to achieve that many) could be overestimates if breakthroughs in QEC keep happening. |
| Algorithmic Advancements | Dynamic updating: The benchmark inherently adapts to algorithmic changes because the target moves. I explicitly included, for example, Gidney’s 2025 factoring optimization which reportedly could reduce the qubit/time requirements by another 20× beyond prior methods. If tomorrow someone finds a way to halve the T-gate count or use a clever technique to cut needed qubits by 30%, those improvements would raise the readiness score (since less hardware is needed now to reach the goal). In other words, my metric is always looking at “the best known way to break RSA-2048” and measuring against that. Historically, we’ve seen a downward trend in required resources (e.g., from needing millions of qubits as estimated a decade ago to under one million now). My approach rides that trend continuously. | Static algorithm set: QTT includes the latest published algorithms (as of its last update). For instance, it has Baseline Shor, the Gidney-Ekerå 2019 method, and the Chevignard et al. 2024 improvement, each as an option. But it cannot anticipate new algorithms not yet in the literature. So if an unexpected breakthrough occurs (and in quantum algorithms, they do happen in leaps), QTT’s default model would suddenly be too pessimistic until manually revised. The authors explicitly note this limitation, that the tool is only as up-to-date as the known research. They somewhat hedge this by offering multiple algorithm choices (to see the impact of better algorithms on the timeline), but essentially QTT might lag real-world advancements. It treats algorithmic progress as stepwise updates rather than a given, whereas my approach kind of factors in an expectation of ongoing improvement (at least in the way I talk about results). |
| Definition of “Broken” | Uses a practical threshold: broken = able to factor in ~1 week. This is a clear line in the sand that I believe is relevant for security, a week-long computation is definitely within an adversary’s operational capability (especially if they can run many in parallel for multiple keys). By setting the bar here, I ensure the benchmark alerts us as soon as a quantum computer enters the range of being a serious threat to RSA. It doesn’t require the attack to be trivial or instantaneous, just feasible within a short time window. This may make my Q-Day seem earlier than some others predict, but I consider that timeframe (days to a week) as the point at which no one can safely use RSA-2048 anymore. | Likely uses a stricter definition of broken = able to break in hours or less. The QTT timeline for RSA-2048 (~2051) probably corresponds to when a quantum computer can factor a key in, say, a few hours. If an attack takes weeks in the 2030s, QTT might label RSA-2048 as “still holding (for now)” in terms of risk level. This conservative criterion pushes the “official” break date later. The rationale might be that if a quantum attack takes a week or two in 2035, defenders could respond by rotating keys or using hybrid systems to mitigate risk until quantum tech improves further. Only when a single key can be cracked fast enough to be a realistic threat in real-time communications (minutes or hours) do they ring the bell. I understand the reasoning, but I tend to disagree – from a policy standpoint, once a week-long quantum factorization is possible, the trust in the algorithm is effectively gone. |
| Risk Philosophy | Urgency and early warning: My benchmark is meant to shout “the storm is approaching” as soon as you can discern it on the horizon. By quantifying progress and saying e.g. “we are 20% of the way to a CRQC,” I intend to cut through cognitive bias (where people might ignore qualitative warnings). It’s a form of a risk communication tool – simple number, hard to argue with once agreed on inputs, and inherently alarming as it ticks upward. The philosophy is that it’s better to mobilize defenses too early than too late. I openly choose less conservative inputs in building the metric because I’d rather not lull anyone into waiting until 2040 to act, only to find out in 2030 that we were wrong. In essence, it’s advocacy via analytics: compelling stakeholders to prepare for post-quantum now, by showing quantitatively that the threat is progressing quickly. | Caution and credibility: QTT’s philosophy is to be analytically cautious so that it doesn’t overhype the threat and lose credibility. It’s built to inform long-term risk management in critical sectors (finance, government, etc.) where making a drastic move too early can be costly. The conservative defaults reflect an intention to err on the side of assuming slower progress – this way, if reality turns out faster, one can update the forecast (or say “things accelerated beyond expectations”), but if one had cried Q-Day in 2030 and it doesn’t happen, that could undermine trust. QTT’s creators likely wanted to differentiate from more aggressive predictions and provide a baseline that decision-makers can comfortably use without second-guessing whether it’s hype. The trade-off, however, is that if users are not quantum experts, they might take the conservative scenario as “expert gospel” and delay action dangerously. So the tool must be used with wisdom, as the authors themselves note, its value is in exploring scenarios, not in the exact dates it spits out for a given default. |
| Intended Use | Tracking and rallying: This benchmark is a living metric that I update and discuss in my work to track the ongoing evolution of quantum threat capabilities. It’s intended for regular updates (e.g., annually or semi-annually publishing the current score) to say “this is where we stand.” The simplicity makes it a good communication device to rally support for PQC migration, R&D investment, etc., by illustrating progress in a tangible way (similar to how the “Doomsday Clock” quantifies nuclear threat in minutes to midnight). It’s not a tool one downloads, but rather a framework for thinking about readiness that I encourage others to adopt or refine. Ultimately, it’s a gauge for the community to measure how far quantum computers have come toward cryptographic relevance. | Scenario planning and policy input: QTT is built to be used by analysts and organizations to ask “What if…?” For instance, a government agency can use QTT to test different technology curves: what if there’s a breakthrough and physical qubits scale faster? What if error correction remains daunting? They can then derive a range of years for Q-Day and plan accordingly (e.g., set internal deadlines for transitioning systems by the early estimate, while keeping contingency for the later estimate). It’s also educational; it forces users to understand the interplay of qubit count, error rate, and algorithmic efficiency. As an open-source notebook/tool, it is something the community can improve and adapt (though it’s early days, and currently not many are contributing yet). The ideal use of QTT is to inform standards bodies, policymakers, and industry consortia about the rough timeframes and key technical drivers, in a transparent, data-driven manner. It’s a tool for careful strategizing rather than making headlines. |
Conclusion: Using Both in Tandem for Quantum Readiness
In conclusion, my CRQC Readiness Benchmark and the Quantum Threat Tracker serve complementary roles in understanding and preparing for the quantum threat. My benchmark provides a high-resolution snapshot of where we stand today on the journey to a cryptographically relevant quantum computer, distilled into a single progress metric. QTT provides a broader forecast of where we might be headed in the future, across multiple algorithms and under various assumptions.
The differences in their outputs, early 2030s vs. 2050s for RSA-2048’s fall, largely come down to differing assumptions and goals. I intentionally incorporate the latest breakthroughs and even industry optimism to ensure we’re not caught off-guard by rapid advances. QTT intentionally leans toward caution to avoid complacency but risks underestimating the pace of innovation. Recognizing these differences, one can actually use both tools together: for example, track the CRQC readiness score over time to see how fast capabilities are actually advancing, and at the same time use QTT (updated with current data) to play out scenarios and stress-test your preparedness plans. If my benchmark is climbing steadily and approaching 1.0, that’s a signal to double-check QTT with more aggressive settings and see how much sooner the dates come out.
The key takeaway I want to impart is that waiting until a single consensus “Q-Day year” is certain would be a mistake. Whether one believes more in the conservative QTT default or my more optimistic metric, the prudent course is to start transitioning to post-quantum cryptography (PQC) now. The discrepancy between 2030 and 2050 in these models is not an academic debate, it’s a reminder that the future is uncertain and could surprise us on the early side. By monitoring progress (with benchmarks like mine) and preparing for worst-case timelines (using tools like QTT, but mindful to update its assumptions), we can ensure that we’re ready for the quantum era before the attackers get there. In the end, both approaches underline the same message: the clock is ticking, even if we debate how fast, and proactive quantum readiness is the only safe strategy.
Quantum Upside & Quantum Risk - Handled
My company - Applied Quantum - helps governments, enterprises, and investors prepare for both the upside and the risk of quantum technologies. We deliver concise board and investor briefings; demystify quantum computing, sensing, and communications; craft national and corporate strategies to capture advantage; and turn plans into delivery. We help you mitigate the quantum risk by executing crypto‑inventory, crypto‑agility implementation, PQC migration, and broader defenses against the quantum threat. We run vendor due diligence, proof‑of‑value pilots, standards and policy alignment, workforce training, and procurement support, then oversee implementation across your organization. Contact me if you want help.
Related Content